Global project pipeline grows over 20% but implementation lags
Key Takeways
- Prospective utility-scale solar and wind capacity — projects that have been announced or are in the pre-construction and construction phases — grew by over 20% globally in 2024 from 3.6 terawatts (TW) to 4.4 TW, only half of what is needed for global tripling renewable goals.
- Outside of China and the Group of 7 (G7) rich nations, only half of solar and wind projects designated to come online in 2024 were actually completed on time.
- Global operating capacity increased by 14% in 2024, as at least 240 gigawatts (GW) of utility-scale solar and wind came online.
- Despite their 45% share of global gross domestic product (GDP), G7 countries are building only 10% of planned solar and wind projects.
Prospective solar and wind capacity grew by over 20% in 2024
During 2024, prospective solar and wind capacity grew by over 20% from 3.6 terawatts (TW) to 4.4 TW1, according to new data from Global Energy Monitor (GEM). GEM’s Global Solar Power Tracker and Global Wind Power Tracker include all projects that have been announced, entered pre-construction, or are currently under construction for solar capacity over 1 megawatts (MW) and utility-scale wind capacity over 10 MW. Utility-scale solar and wind are largely equal in their prospective development, with 2 TW and 2.5 TW respectively. However, solar photovoltaic (PV) is anticipated to account for 80% of global renewable energy capacity growth until 2030, due to the expanding distributed solar market and the construction of new large-scale projects.
Despite the surge in prospective capacity, even if the entirety of the 4.5 TW were to become operational by 2030, GEM finds that it would still not be enough to reach the goal of tripling renewables capacity by 2030 set at COP28, which requires roughly 9 TW of wind and solar to be built. Moreover, the construction rates of solar and wind outside of China remain low, with only 7% of prospective capacity (226 gigawatts (GW)) currently under construction, jeopardizing the pace and scale necessary for renewables implementation.
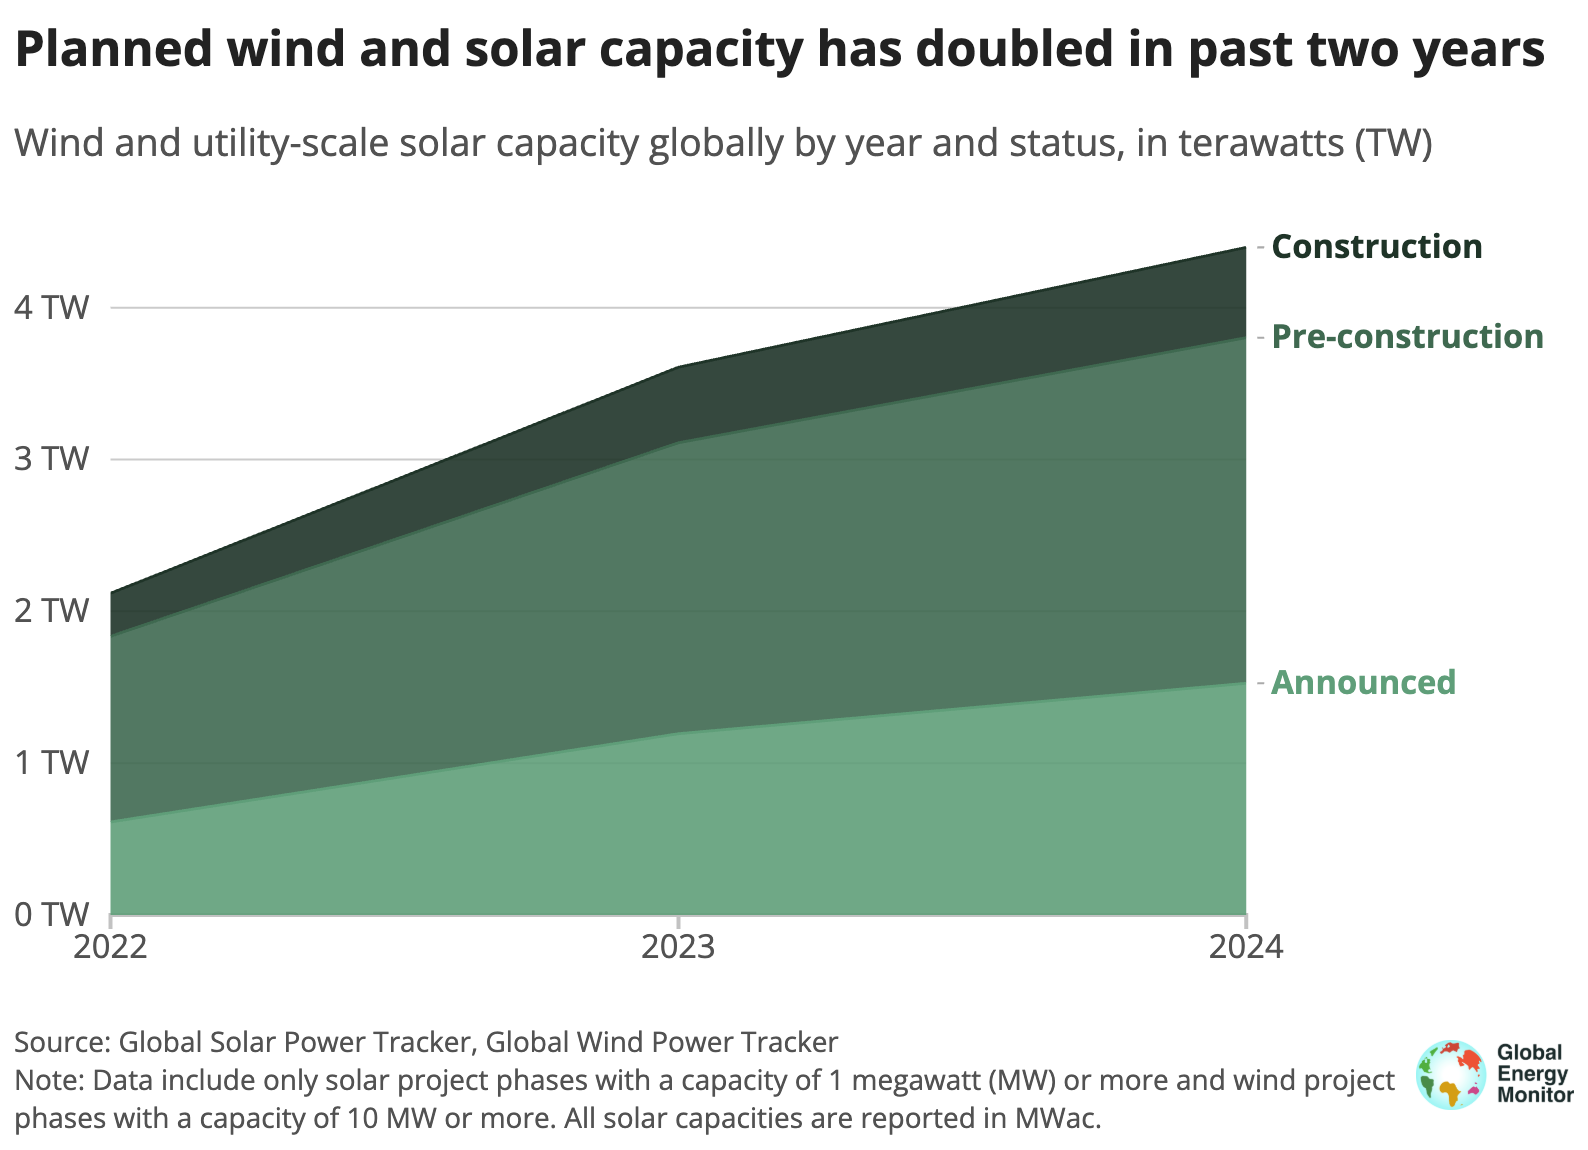
Figure 1
China has the largest prospective capacity for both utility-scale solar and wind, with over 1.3 TW. Over one-third of these planned projects (36%) are already under construction, compared to the global average elsewhere of 7%. Meanwhile, India, with the world’s fifth-largest GDP and 30% of projects in construction, targets adding nearly 130 GW of prospective utility-scale solar and wind capacity in the upcoming years, and 35 GW of these additions will be connected to the grid by March 2025.
Figure 2
On-time solar and wind project completion rates lag
Historically, not all planned projects become operational on time. Existing limitations in the physical grid, permitting bottlenecks, and lack of financial mechanisms are often reasons for low completion rates. GEM data included 185 GW of solar and wind farms that were under construction as of December 2023 and designated to become operational before the end of 2024. Globally, only 59% of these projects started producing electricity on time.
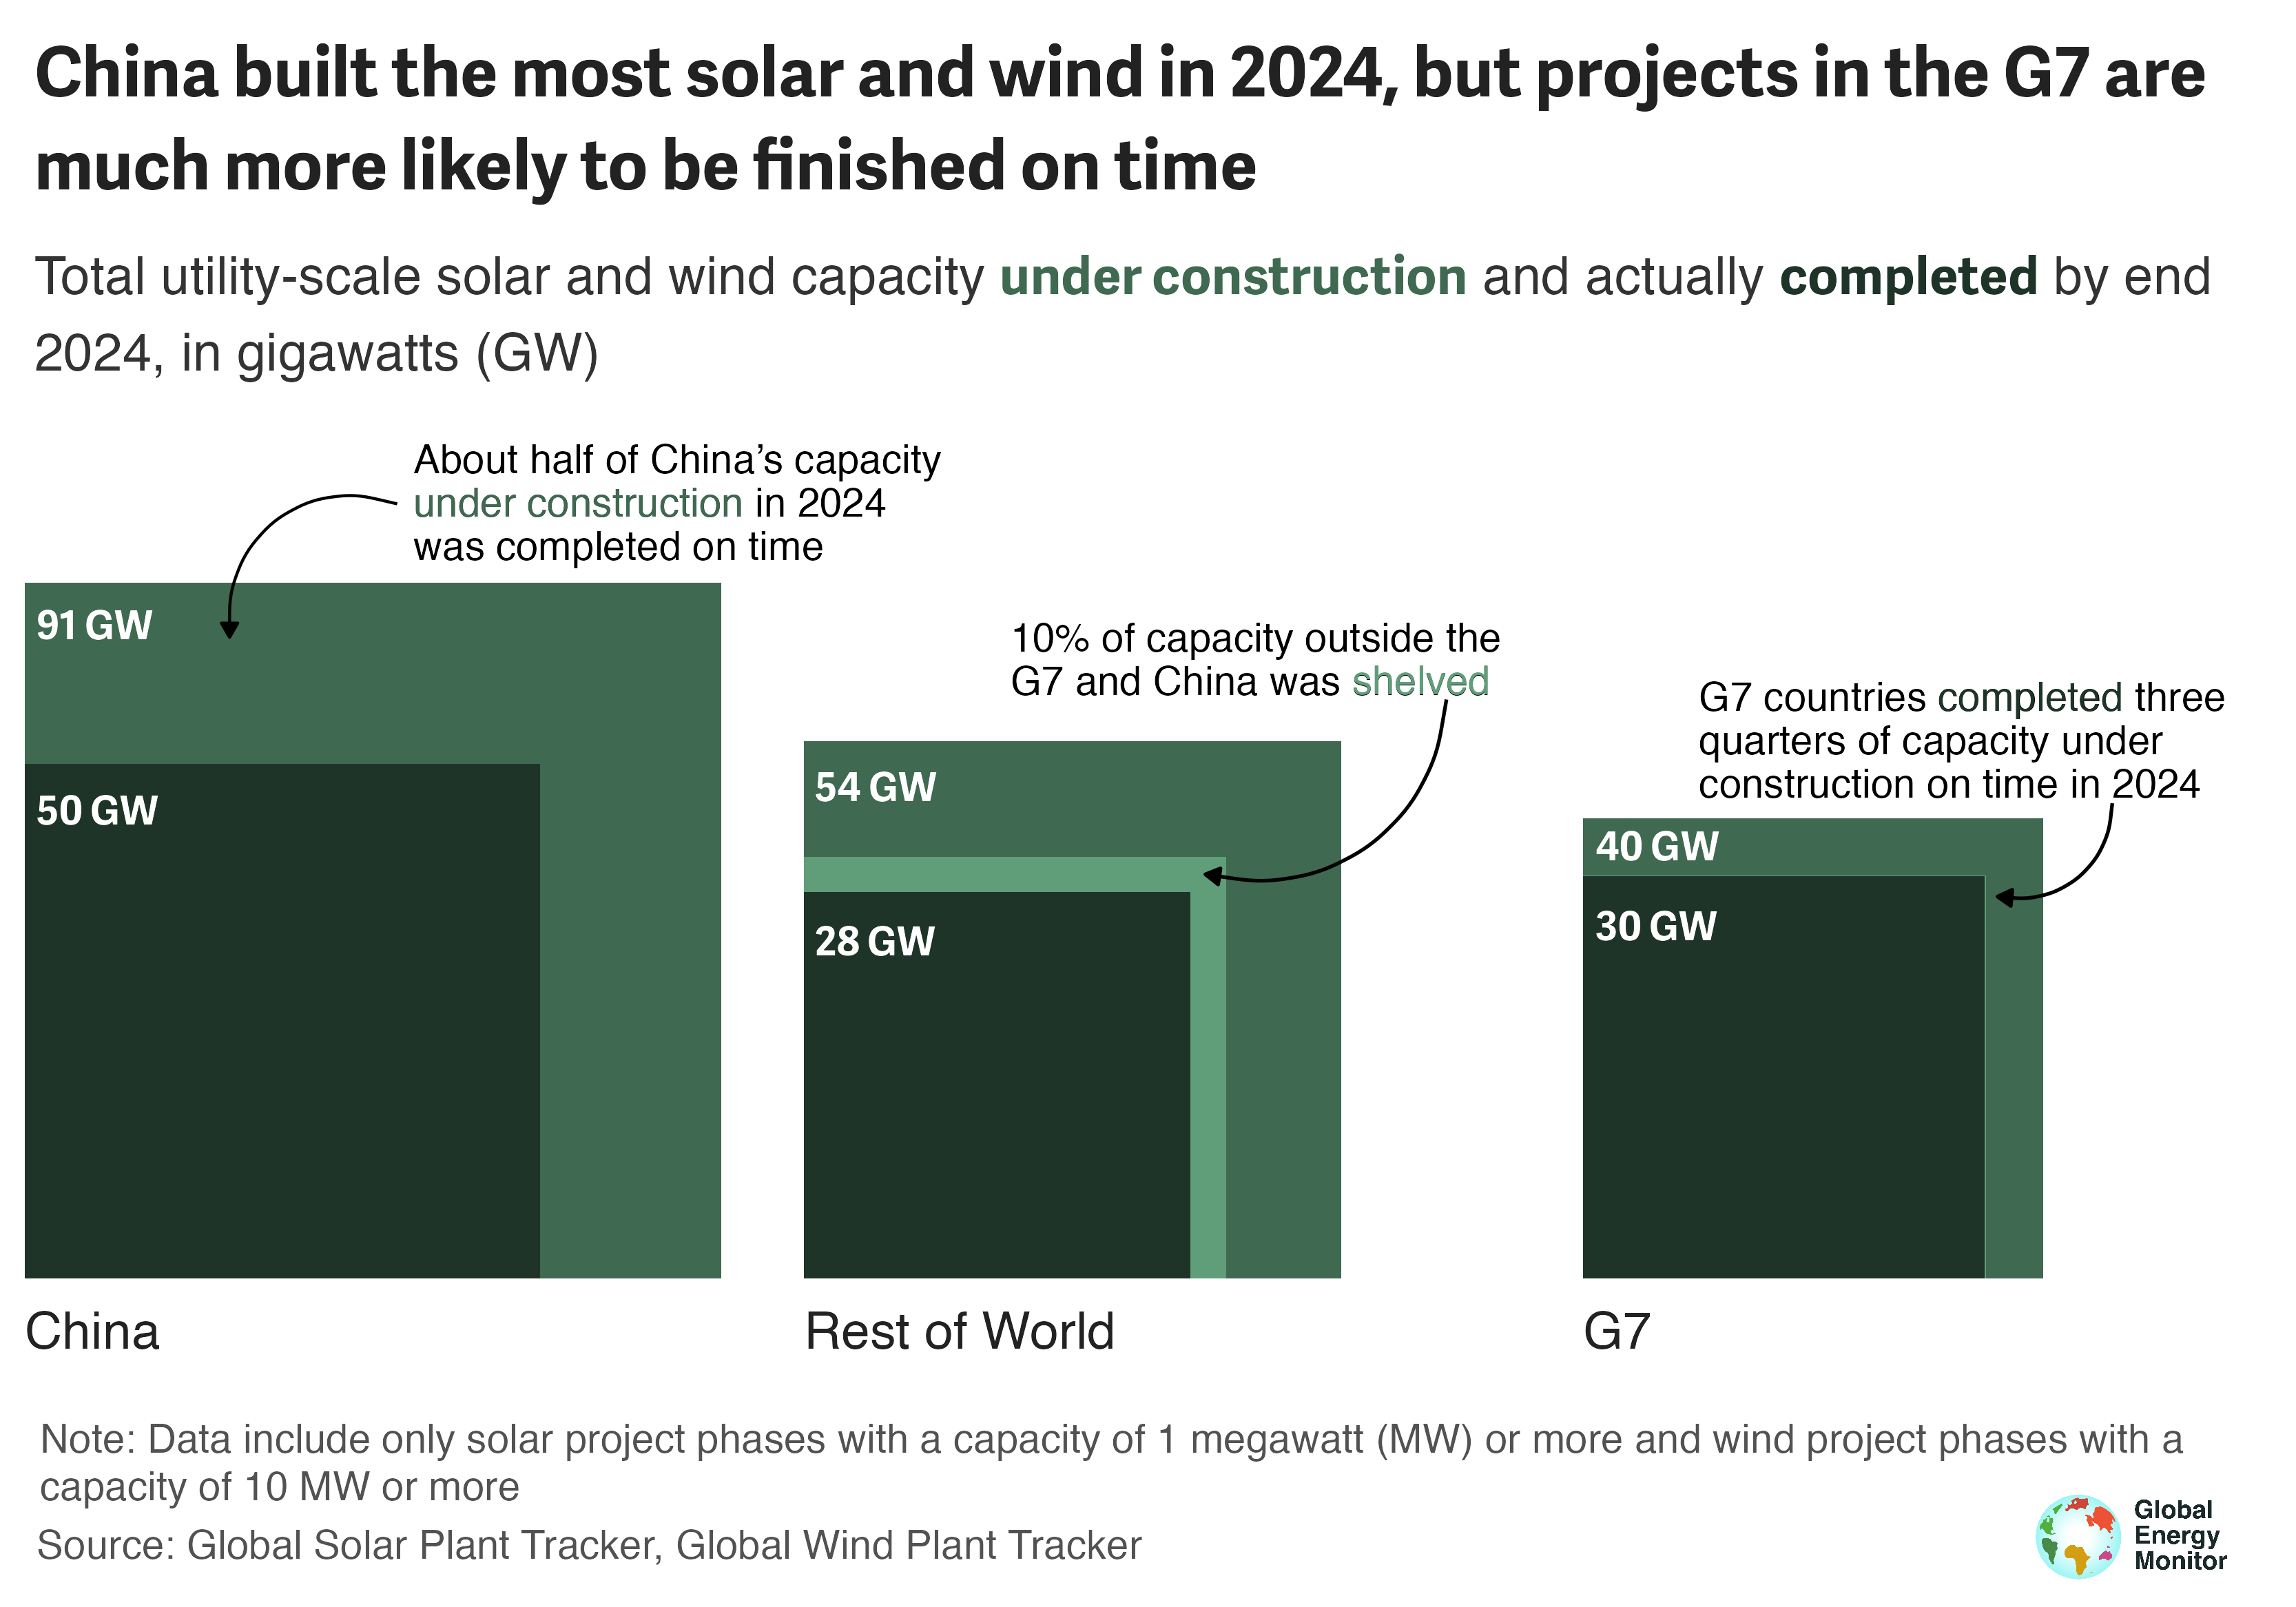
Figure 3
A disparity exists in completion rates across G7 countries,2 China, and the rest of the world. About 76% of solar and wind projects in G7 countries became operational within the originally planned time frame. This figure declines to 55% in China and further drops to 52% in other non-G7 countries. Moreover, 10% of the projects in other non-G7 countries were shelved in 2024 instead of becoming operational, whereas, this number is negligible in G7 countries and China. This means that only half the planned solar and wind capacity came online on time outside China and the G7, while one-tenth of this capacity was suspended.
Although the permitting procedures for solar and wind farms differ in some countries, it is safe to assume projects under construction already secured land rights, permits, and grid interconnection pre-approvals before the beginning of construction. This highlights the significance of mobilizing public and private investments in developing economies to complete planned renewable projects on time.
Correspondingly, the final days of COP29 were dominated by global climate finance discussions. Countries were encouraged to submit more ambitious, investable, and equitable nationally determined contributions (NDCs) to transition away from fossil fuels in energy systems. Most of these and other discussions in the international arena focus on total operating and planned capacity, while low project completion rates, and potential reasons behind them, are overlooked.
At least 240 GW of utility-scale solar and wind capacity became operational in 2024
The February 2025 release of the Global Solar Power Tracker and the Global Wind Power Tracker shows at least 240 GW of utility-scale solar and wind became operational in 2024.3 This is a lower figure than the International Energy Agency’s earlier forecast (378 GW), as it does not include projects for which the start year is unknown.
China has the largest operating capacity for utility-scale solar and wind. GEM has tracked at least 891 GW of operating utility-scale solar and wind capacity in China. China officially installed 277 GW of utility and distributed solar and 80 GW of wind in 2024, and GEM has tracked 136 GW of those utility-scale solar and wind installations to the asset level.
In the first seven months of 2024, solar and wind in the United States produced more energy than coal, a first for the country. By the end of 2024, the United States had 274 GW of operating solar and wind capacity. India has added at least 10 GW of new solar capacity annually since 2021 and has an operating capacity of solar and wind above 109 GW, as of December 2024.
Figure 4
The wealthiest nations aren't building their fair share of solar and wind projects
China is not only leading the world in operating projects but it also plans to build more than two-thirds (70%) of all utility-scale solar and wind projects in the coming years. Comparing the share of global GDP and under-construction projects for G7, China, and the rest of the world illustrates an asymmetry for utility-scale solar and wind projects. G7 countries own about 45% of global GDP but only plan to build 10% of global solar and wind projects. From another perspective, G7 countries have half the world's wealth and are constructing the same amount of wind and solar power — about 59 GW — as the countries that make up the bottom quarter of GDP.
Figure 5
Political barriers and implementation disincentives could further reduce G7 countries’ contribution to renewables in the upcoming years. In January 2025, the Trump administration issued an executive action to suspend new offshore wind leasing, which would halt about 5 GW offshore wind projects currently under construction. However, the International Renewable Energy Agency has called for G7 countries to increase their solar and wind targets to comply with the 1.5°C pathway targets.
It should be noted that in addition to having financial resources to invest in solar and wind energy, resource potential for solar and wind and other technical factors are considered when locating these facilities. From an energy democratization and just energy transition viewpoint, planning for a larger share of global renewables to be built in developing countries is favorable.
However, non-G7 countries, excluding China, are set to build only one-fifth of the global solar and wind projects in the upcoming years.
About The Global Solar And Wind Trackers
The Global Solar Power Tracker is a worldwide dataset of utility-scale solar photovoltaic (PV) and solar thermal facilities. It covers all operating solar farm phases with capacities of 1 megawatt (MW) or more and all announced, pre-construction, construction, and shelved projects with capacities greater than 20 MW. The Global Wind Power Tracker is a worldwide dataset of utility-scale, on- and offshore wind facilities. It includes wind farm phases with capacities of 10 megawatts (MW) or more.
About Global Energy Monitor
Global Energy Monitor (GEM) develops and shares information in support of the worldwide movement for clean energy. By studying the evolving international energy landscape and creating databases, reports, and interactive tools that enhance understanding, GEM seeks to build an open guide to the world’s energy system. Follow us at www.globalenergymonitor.org and on Twitter/X @GlobalEnergyMon.
GEM data serves as a vital international reference point that is being used by agencies including: Intergovernmental Panel on Climate Change, International Energy Agency, United Nations Environment Programme, U.S. Treasury Department and the World Bank. Furthermore, industry data providers such as Bloomberg Terminals and the Economist and academic institutions like University of Oxford and Harvard University draw on this data.
Media Contact
Diren Kocakuşak
Research Analyst